The PyMemoryEditor GUI App
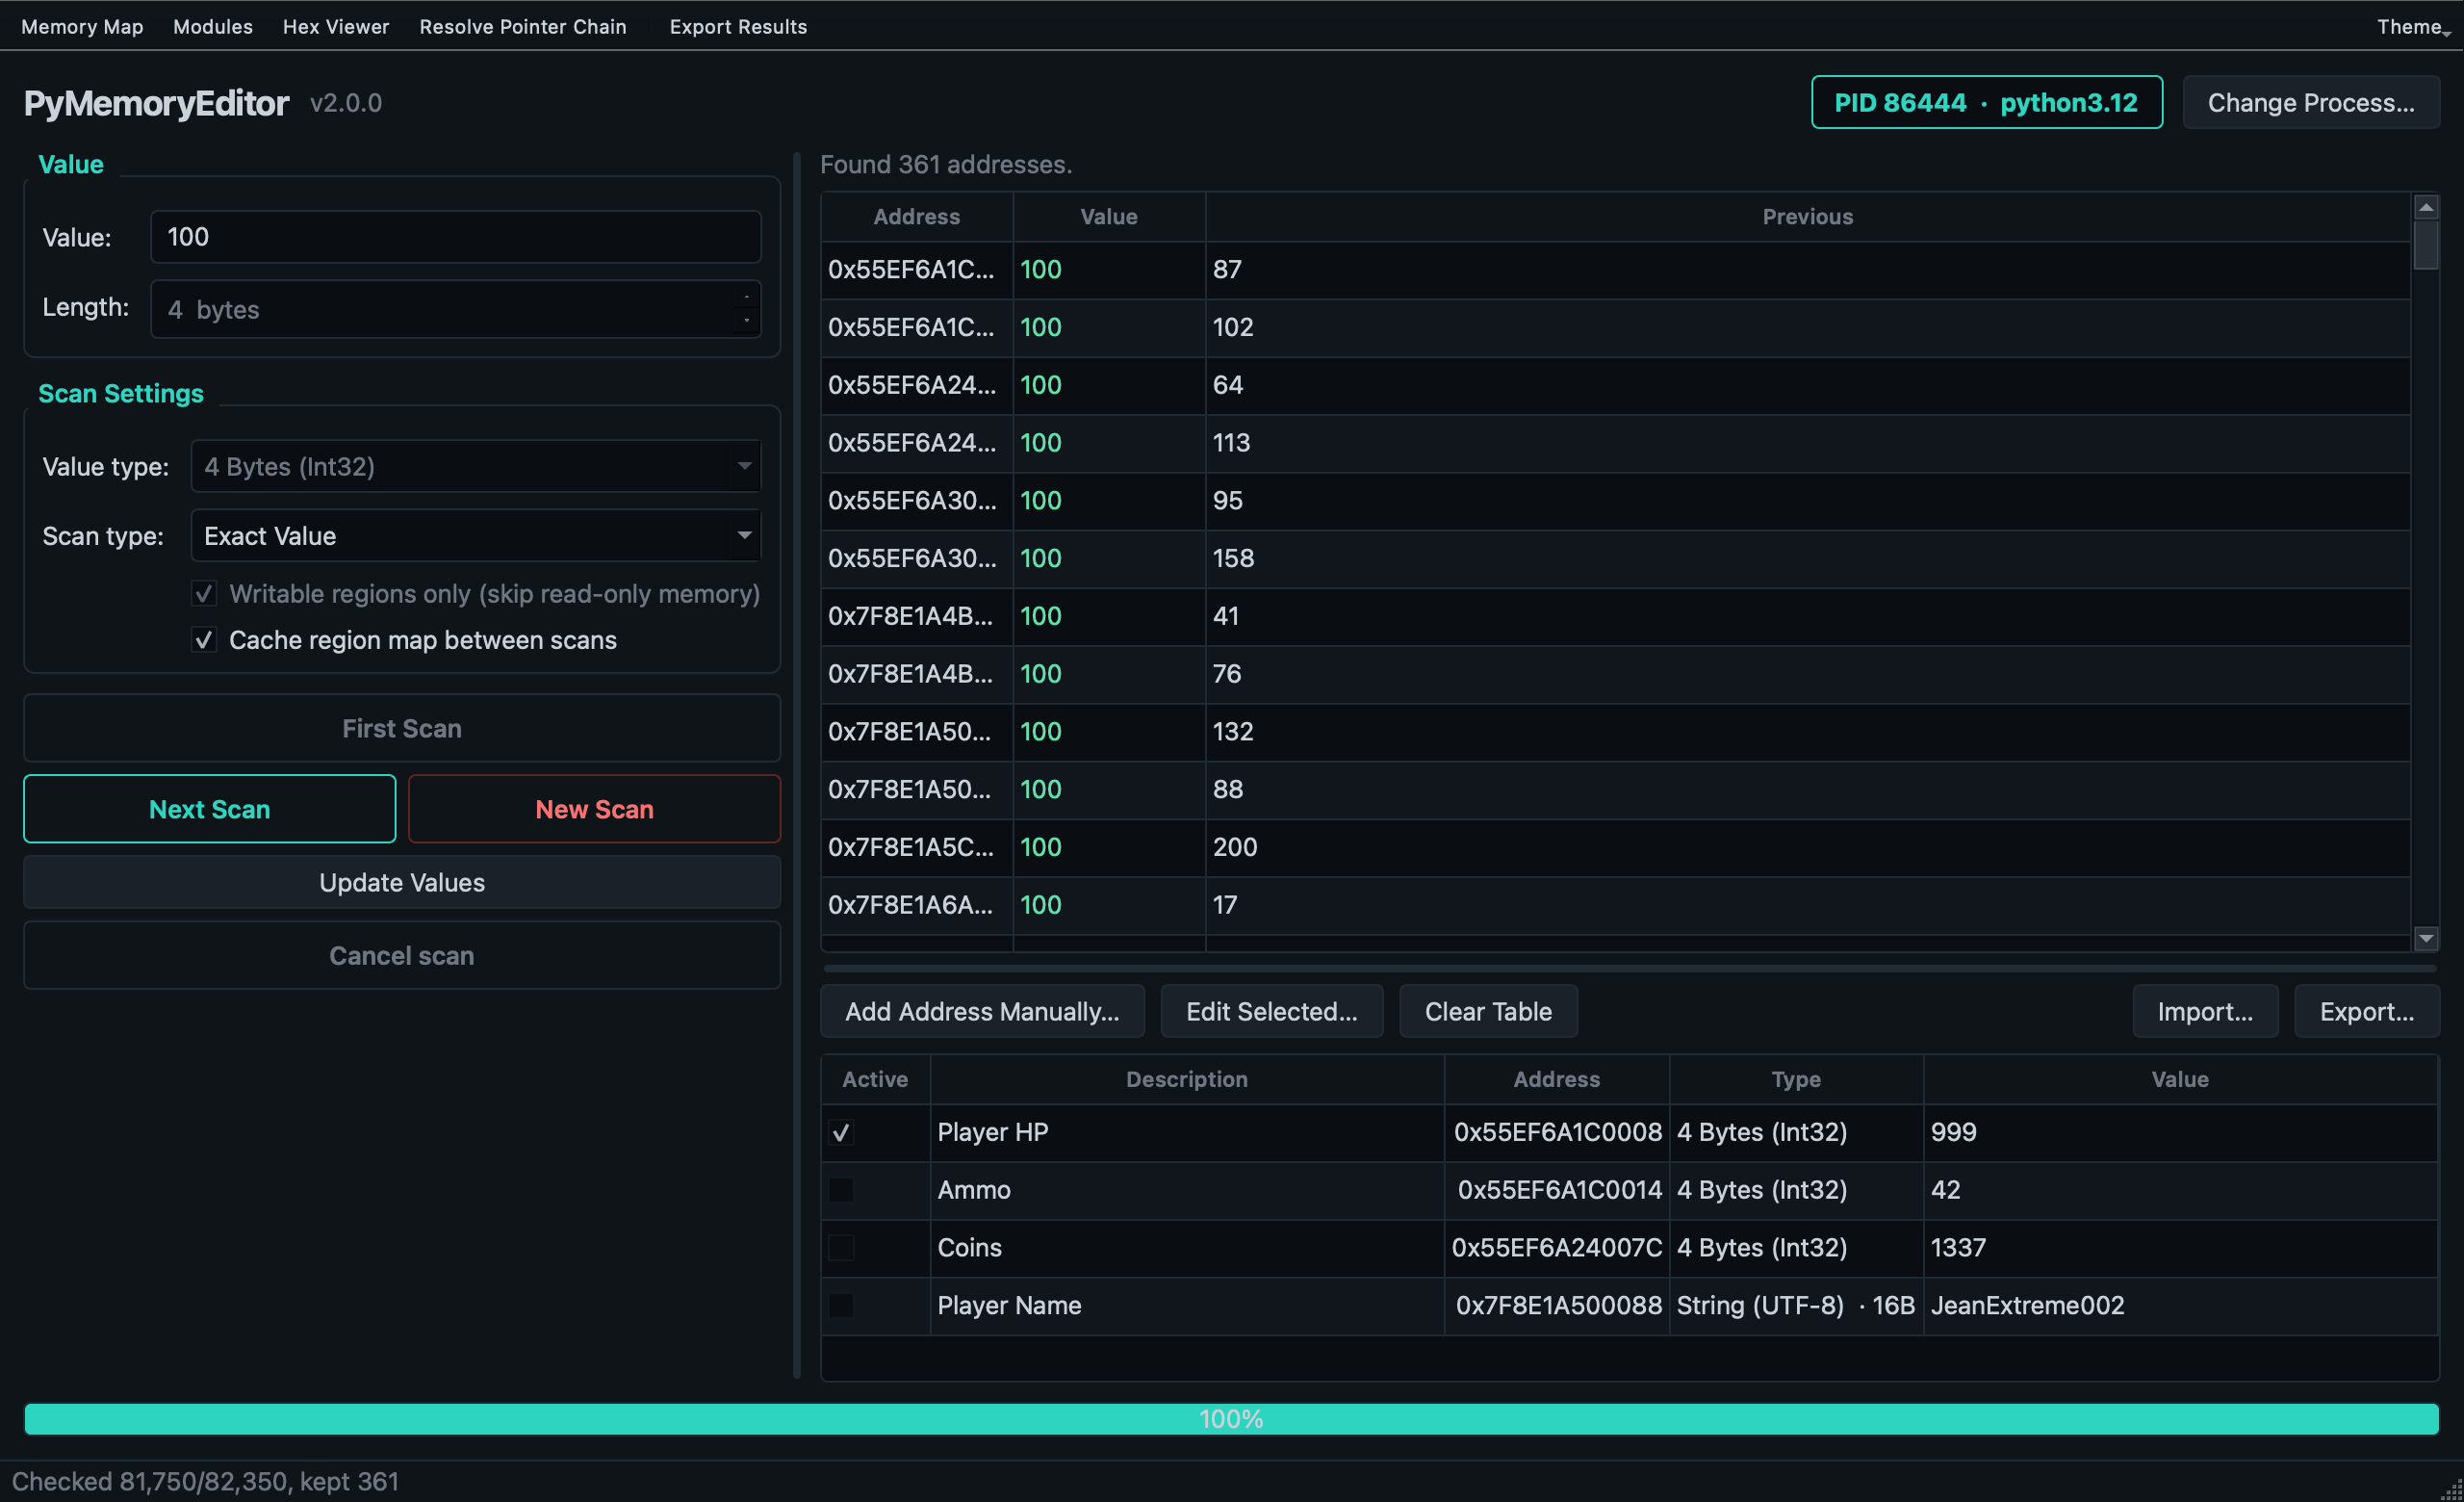
PyMemoryEditor ships with a polished cross-platform GUI built on PySide6 (Qt for Python). It’s a Cheat Engine-inspired memory scanner that exercises every public surface of the library — so it doubles as a living demo and a teaching tool.
If you’re new to memory editing, start with the app before writing code.
Install
pip install "PyMemoryEditor[app]"
The app extra pulls in PySide6 and other dependencies. The core library remains dependency-free.
Launch
From any terminal:
pymemoryeditor
The app opens with the Open Process dialog, where you pick a target by name or PID.
What’s inside
🎯 Scanner
Every
ScanTypesEnummodeAll integer widths, Float, Double, Boolean, String (UTF-8), and Byte Array
Range, AOB / byte-signature (IDA-style), and regex search
🧲 Refine workflow
First Scan → Next Scan (Cheat Engine style)
Six more comparison modes (increased, decreased, changed, …)
Live progress bar
📋 Cheat table
Live value updates
Freeze or overwrite values continuously
Per-entry custom labels
JSON import / export
🗺️ Memory map
All regions with their attributes (address, size, R/W/X permissions)
Auto-refresh as the memory layout changes
Allocate and free memory directly from the map
🔬 Hex viewer
Live hex dump with in-place write-back
Jump to any address, with auto-refresh
📦 Modules
All loaded modules (DLLs / .so / .dylib) with base address, size, and path
Auto-refresh as modules are loaded or unloaded
Double-click to open in the Hex Viewer
🧩 Pointer scan
Same engine as
scan_pointer_pathsSave / load scans as JSON
Rescan and compare to narrow results down
Cross-platform dark theme
The app ships with several built-in dark themes (Kali Teal by default). Pick one from the Theme button on the toolbar; your choice is remembered between runs.
Typical workflow
Open a process from the startup dialog (or later via
File → Change Process…).Run a First Scan: pick the value type, type the value you can see, hit First Scan.
Refine with Next Scan after the value changes — pick Exact Value with the new number, or one of the increased / decreased / changed shortcuts.
Double-click a result to add it to the Cheat Table.
Freeze the value with the checkbox or change it from the Cheat Table.
(Optional) Run a Pointer Scan on the result to find a chain that survives restarts.
Importing & exporting
The Cheat Table and Pointer Scan results are stored as plain JSON, so you can:
Share a cheat table with a friend.
Version-control your saved pointer scans.
Diff scans by hand.
The pointer-scan format is documented in PointerPath.
When to use the app vs the library
Use the GUI when…
You’re exploring a target interactively.
You’re learning memory editing.
You want to inspect what’s available before writing code.
Use the library when…
You want to script a workflow or build a tool.
You want to embed memory access into a bigger application.
You need batch processing, automation, or CI integration.
See also
Quick Start — the same workflow, in code.
Logging — the Log Console exposes the library’s logger.